May 26 2020
The Health-Sector Costs of Our Coronavirus Response

This report was written by Anthony Elowsky (Analyst) and Robert Niehaus (Managing Director). For further information about this report, please contact Anthony Elowsky.
Where Do We Stand Now?
Our nation-wide stay-at-home response to the COVID-19 pandemic has crushed the US economy. More than 20 million jobs – two decades of employment growth – disappeared in the two months from mid-February to mid-April. Unemployment rose from less than 4 percent in February to almost 15 percent in April. Losses of household income and wealth measured in the trillions of dollars accompanied the closure (and in many cases bankruptcy) of millions of businesses. We are now in the precarious position as a nation of re-opening vast portions of our economy with most Americans still frightened of the health consequences of their everyday routines – working, attending school, shopping, church-going, traveling, and spending time with family and friends.
One element of America’s pandemic response has been to focus most of US health care on COVID-19 as a priority over other non-emergency health problems. Over a seven-week period from mid-March until early May, nearly all medical, dental, mental-health, and similar practices nation-wide saw their functions curtailed. States and localities, acting on Federal recommendations, ordered restrictions on medical activities to conserve resources to treat the virus. At the same time, many patients declined to visit their doctors (other than via tele-health procedures) out of concern for possible disease transmission. Hospitals also avoided scheduling non-emergency procedures. The health issues of the American public that were not treated ranged from routine dental care to skin cancer screening to angiograms. These non-treatments likely caused uncountable personal episodes of difficulty ranging from inconvenience to profound worry to physical and mental suffering, and possibly even death.
The good news is that in the first three weeks of May we have seen a relaxation of these restrictions. Medical and dental practices are seeing non-emergency patients in person, although tele-health appointments continue. Hospitals are starting to schedule non-emergency procedures. A semblance of normalcy is returning and is likely to continue, barring a resurgence of COVID-19 cases that might lead to a reversion to the restrictive policies previously in place.
We presume that there were benefits to this public-health approach to fighting the pandemic, though the gains are hard to measure since we will never know with accuracy how many COVID-19 cases and deaths we avoided. But what about the costs of these policies? Surely they are important. All of the health care normally provided to Americans has a purpose, and the value of that care is at least as great as the dollars that people (directly out of pocket, or indirectly through their insurance coverage) pay for the care they receive. Otherwise, why would they bother to have health insurance or go to the doctor? These dollars in turn direct resources (doctors, nurses, other professionals, facilities, supplies, and related resources) to be employed in providing care.
We know about how much Americans spend on health care each year. So we undertook a series of case-study interviews with health-care professionals and service providers to make an educated guess of how much the recent curtailments have affected medical practices and patients. We made some assumptions regarding how these interview results might relate to macro US data, and arrived at a rough calculation of losses. We believe our guesses are in the ballpark, and the costs are staggering in size – about $16.9 billion per week for each week the strictest curtailments were in place, or $118.0 billion for the seven-week period March 15 – May 2. These losses would pay almost 2 million health-care workers average annual salaries of $60,000 for an entire year. Costs continue to mount, at a slower rate, until our health-care scheduling returns to normal.
Our calculations point to two conclusions. First, we must continue to re-balance our health-care sector toward normal function, as we have been doing in the first half of May. Second, we must find smarter ways to combat future public-health crises like this – from a return of COVID-19 or for other causes – if we are to avoid long-term damage to our health-care infrastructure. This brief report describes how we arrived at this estimate, and illustrates our findings using conditions in Santa Barbara County where we live.
The View from Our Hometown
We include this discussion of Santa Barbara County’s stay-at-home experience because it is in many ways typical of much of the rest of the country. Locally, the pandemic has followed the general patterns observed across the nation for less densely populated areas. Our county is home to major federal prison facilities, which created a “hot spot” of infections, and most of our cases have occurred in that contained prison environment. As of May 26 there were 1,551 confirmed COVID-19 cases in the county.[1] Figure 1 shows the distribution of cases across the county. The small community of Lompoc, where the prison is located, has the most confirmed cases at 1,073, which includes nearly 1,000 prison cases.
Figure 1. Cumulative COVID-19 Cases by Area in Santa Barbara County
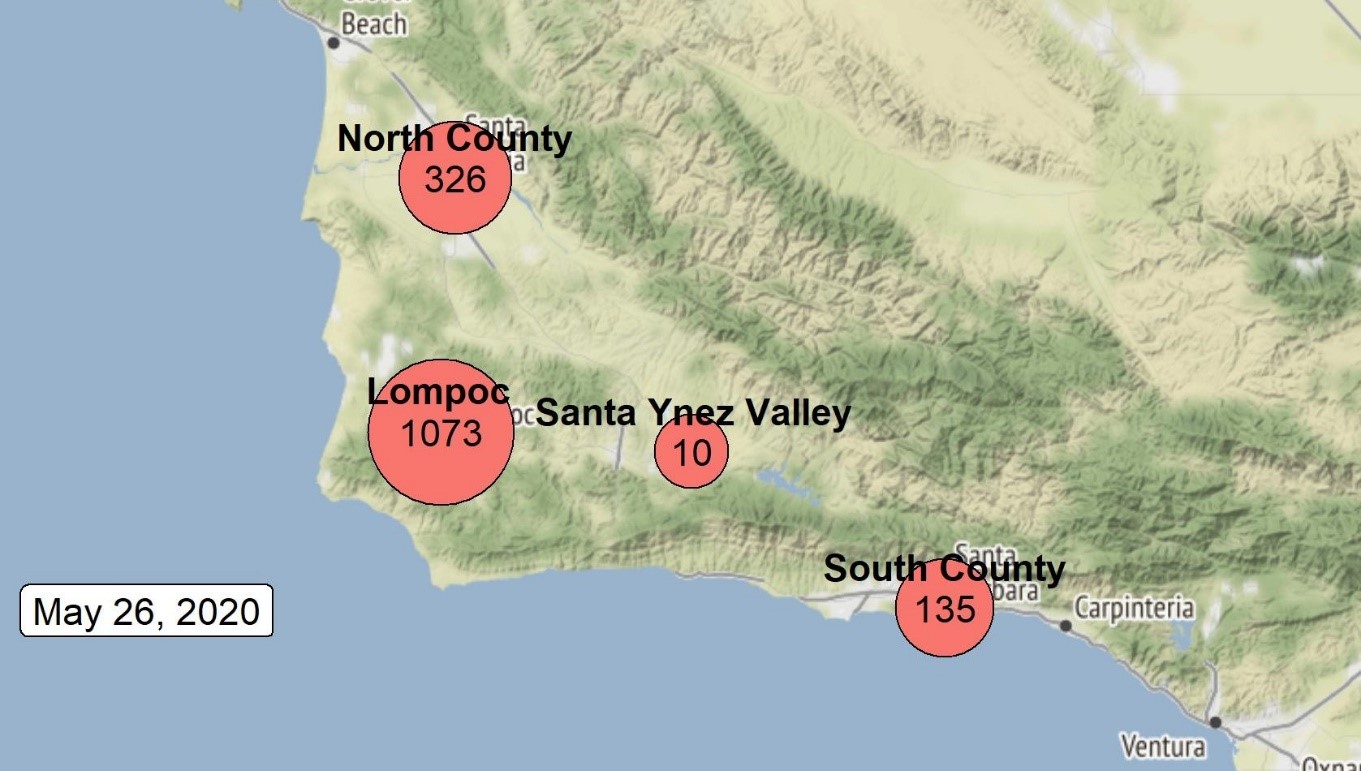
Source: Santa Barbara County Public Health Department, May 26, 2020. Note 1: South County includes the unincorporated communities of Gaviota, Isla Vista, and Montecito; unincorporated areas adjacent to Santa Barbara and Goleta; and the cities of Santa Barbara, Goleta, and Carpinteria. Note 2: North County Incudes the unincorporated communities of Sisquoc, Casmalia, Garey, Cuyama, New Cuyama, and Orcutt as well as the cities of Guadalupe and Santa Maria.
There have been 12 confirmed deaths attributed to COVID-19 (including cases with co-morbidity factors) county-wide as of May 26. This is equivalent to approximately 2.7 deaths per hundred thousand population, which is less than the average for California as a whole (about 10 deaths per hundred thousand). New York State, by comparison, has the highest per capita death rate in the United States, at 150 per hundred thousand residents. California’s most populous county, Los Angeles, records 20.3 deaths per hundred thousand. Rural Kings County in the central part of the state has had only 2 confirmed COVID-19 deaths, putting Kings County’s number at 1.3 deaths per hundred thousand.[2]
Original projections of the pandemic’s impact indicated that more than 22 million cases would occur in California,[3] out of a total population of about 40 million. Relative to the state’s hospital capacity, this would have constituted a public health catastrophe. So state and local officials took unprecedented measures to reduce potential transmission and prevent medical facilities from being over-run. These measures, typical of those implemented throughout the nation, included stay-at-home orders, shut-down of “non-essential” activities, and a moratorium on non-emergency medical procedures.
Figure 2 shows the trajectory of COVID-19 infection across Santa Barbara County. Fortunately, the dire original state-wide forecast proved to be greatly exaggerated, with total cases in California at 90,631[4] and total cases in the county at 1,551 as of May 26.
Figure 2. Total and In-Prison COVID-19 Cases in Santa Barbara County as of May 26, 2020
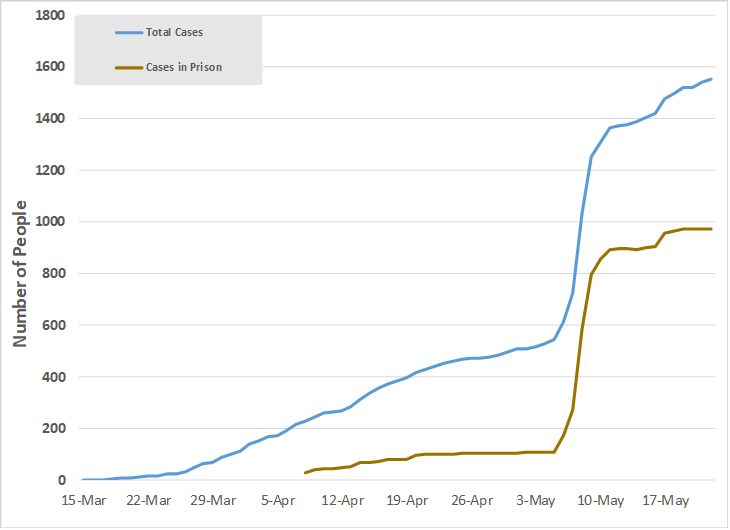
Source: Santa Barbara County Public Health Department, May 26, 2020.
What Are the Medical Professionals Telling Us?
We conducted a series of interviews with health-care professionals across the country to compile case-study information on the impacts of operational restrictions on medical practices. These included professionals in the fields of primary care, community medical and dental health, mental-health family counseling, hospital operation, rehabilitation (occupational and physical therapy) services, and administrative support to hospitals, independent practices, and outpatient care and surgical facilities. These interviews were wide-ranging, and we have summarized our findings in the general sequence the shut-downs have followed:
- How Restrictions Started. Restrictions were imposed in some cases by direct order of state and local public health authorities, following federal guidelines, and in other cases at the initiative of the providers themselves based on general government-agency instructions. Impacts of the restrictions depended on the types of care provided as well as the business models of the organizations providing services.
- Impacts on Patient Volumes. Patient-care volumes were generally down 50-90 percent during the seven-week period of tightest restrictions (March 15 – May 2) for all types of care. Almost all non-emergency appointments during this time were for tele-health consultations. Ambulatory-care (clinic) facilities saw drops in caseloads of 70-80 percent. Drops in volumes varied greatly from one area to another and by type of care.
- Why Patient Volumes Fell. The reductions occurred for four reasons as enumerated by our interviewees:
- First, providers were directly or indirectly constrained by government order from accepting in-person non-emergency appointments.
- Second, some patients did not believe it was safe to leave home for appointments.
- Third, patients who were hurt financially by broad stay-at-home orders were not able to afford some treatments.
- Fourth, tele-health consultations may not be as effective as in-person visits, and some patients chose not to participate.
- Impacts of Gross Revenues of Providers. Revenues were down 30-80 percent from their February baseline while the tightest restrictions were in place. The entities whose revenues were most adversely impacted were independent practices, especially in medical specialties such as surgery. Institutions receiving partial public (tax-payer) funding suffered smaller proportionate reductions in revenues than those entirely dependent on patient and insurance payments. In some cases, public-supported hospitals saw little or no reductions in revenues if emergency patient loads remained high, though these appear to be exceptions. Public-health clinics receiving about 20 percent of their revenues from tax-payer funding under normal conditions were in some cases also able to obtain additional emergency financing in recent weeks.
- Hospital Impacts. Hospitals generally suffered smaller proportionate reductions in revenues than in-patient volumes. In many cases COVID-19 and other emergency patients require intensive care, which, because of the comprehensive range of services needed, generate substantial hospital revenues per patient. Thus the decline in the number of patients hospitalized was partially offset by increased revenues per patient. In addition, many hospitals receive partial government (tax-payer) funding.
- Impacts on Specialists. Medical specialists saw their patient volumes and revenues severely curtailed, with reductions typically in the range of 50-90 percent. Deferred procedures included colonoscopies, dermatological treatments, cancer screenings, heart exams, ophthalmologist and optometrist exams, cataract surgeries, pediatric inoculations, and dental exams and procedures.
- Turn-around in May. May has seen in-person patient visits, including for the deferred procedures listed above, start to increase, though they remain well below normal for the period prior to the outbreak of the pandemic and the stay-at-home orders. Surgeries deferred in March and April were being scheduled and performed starting in May. Some staff were being recalled in May after having little or no work in April.
- Government Assistance. Payroll Protection Program (PPP) loans and other emergency government aid have been effective in mitigating staffing cutbacks in the sector, though some reductions still occurred. Some practices explicitly attributed their ability to maintain staff hours to the availability of PPP funding. State-supported entities were better able than private practices to offer increased paid time off, child-care assistance, and other employee aid.
- Impacts on Contractors. Businesses relying on independent contractors scaled back the use of contractors as workloads fell, in some cases by as much as 80 percent of pre-restriction levels.
- Limited Options to Reduce Costs. Interviewees indicated that staffing cutbacks were in most cases the only means at their disposal to curtail costs as workloads fell. Other expenses – particularly rents, utilities, insurance, and licensing fees – continued unabated. So net incomes generally fell proportionately more than revenues due to the need to cover these overhead costs out of reduced revenues.
- Staying Power. Based on responses to our interviews, it is likely that private health-care organizations could continue to function at reduced rates (comparable to the partial recovery in May) for 6 to 12 months. This would, however, involve a gradual attenuation of capacity as personnel unable to sustain part-time employment begin to seek jobs elsewhere. Still, some entities may cease operation earlier and staff near retirement age may quit working sooner due to these financial setbacks.
- Impacts on Staff. Interviewees reported work bottlenecks due to inability to obtain day care needed by staff. In addition, since schools were closed, the need for staff to provide home-schooling for their children prevented functions from being as effective as normal.
- Lack of Sufficient PPE Supplies. Dentists and rehabilitation therapists gave up some of their practice’s supply of personal protective equipment (PPE) – masks, gloves, and other items – for possible emergency uses. This was necessary because total PPE supplies were insufficient. These actions constrained these practices’ capacity to see patients other than via tele-health.
- Value of Tele-health. Tele-health consultations were widely seen as quite effective during the restrictions. Interviewees offered opinions that tele-health consultations were typically about 70-75 percent as effective for non-emergency care as in-person visits. Interviewees favored continuation of tele-health procedures as useful tools for patient care once restrictions have ended. Perhaps 50 percent of routine health care consultations might be accomplished using tele-health in normal times.
- Tele-health Limitations. Provider experience with tele-health procedures reinforced knowledge of the characteristics of these procedures. In particular:
- Without specialized equipment it is not possible to record vital signs (pulse, blood pressure, and temperature) or make diagnoses dependent on physical examination rather than solely use of remote visual observation and interview interaction with the patient.
- The effectiveness of mental-health counseling via tele-health relative to in-person consultations depends on the individual patient. Patients on the autism spectrum may not be able to sustain tele-health screen time for the same duration as in-person consultations. Mental-health professionals cannot read body language as effectively via tele-health interviews as they can in person. Simply relaxing requirements to permit in-person consultations with participants wearing protective masks is not effective either, since the masks conceal facial expressions. For patients who may have tendencies to violence, tele-health sessions are safer for the counselor than in-person sessions.
- Impacts on Patient Health. Some patients delayed seeing a doctor due to the restrictions, and this had a negative effect on their health. Of particular concern were chemotherapy and treatment of chronic health problems. Persons with mental-health conditions experienced set-backs in their treatment due to the inability to meet in person with their counselors.
- Mental-Health Impacts. There is reason to believe that the lockdowns have increased mental health problems due to stress, and these are just starting to emerge after two months of stay-at-home restrictions. One interviewee indicated that some of these problems could persist for some time in the future.
- Turn-around Likely to Continue. The months of June and July are expected to see substantial increases in patient loads, and providers are starting to prepare for these. Significant pent-up demand for a broad range of health-care procedures could lead to a surge in activity if restrictions continue to ease. These expectations depend, however, on continued abatement of COVID-19 cases requiring hospitalization.
- Staff Recalls. Recalling staff laid off in March or April could be difficult since the CARES Act provides supplemental unemployment insurance payments of $600 per week through July. These payments are by law not payable if the recipient does not have COVID-19 and declines re-employment. But enforcement of this anti-fraud provision is at state discretion, and could vary from state to state. The disincentive to returning to work before August will be stronger for lower-paid occupations since the $600 weekly supplement (equivalent to $15 per hour) makes it more rewarding to stay unemployed than to work.
We asked participants for their recommendations regarding better ways to provide necessary health care to COVID-19 patients with smaller impacts on their own practices. We received a number of suggestions:
- Disavow sensationalist media treatment of COVID-19 risks. Policy should allay public fears by providing the public-health information people need without allowing extreme or unusual cases to become the perceived norm.
- Accumulate adequate inventories of PPE so that safe non-emergency treatments need not be deferred in order for PPE to be available for emergency use.
- Allow health-care providers more flexibility in treating patients. For example, in the absence of clear risks from socially distanced face-to-face meetings, let the provider decide if face masks are necessary.
- Retain the insurance-reimbursable nature of tele-health procedures so that they may be used on a routine basis as appropriate.
Where Did the Health-Care Jobs Go?
US health-sector job losses have been devastating. The US Bureau of Labor Statistics (BLS) recorded that from March 2019 through February 2020 employment in health care and social assistance increased by a net 374,000 jobs. Employment then fell by 61,000 jobs in March. Since these data reference payrolls for the pay period containing the 12th day of each month, the health-sector job reductions were just starting to be reflected in the March data. The real job losses showed up in the April report (released May 8). From March to April the BLS reported 1.4 million jobs lost in the sector, including 503,000 lost dental office jobs and 243,000 lost physician office jobs.
According to Becker’s Hospital CFO report, over 80,000 hospital staff have been furloughed nationally since the end of March (this number is less than the actual amount because they track only the numbers reported in local news resources).[5] Table 1 shows the estimated number of furloughs by state according to the Becker’s data.
Table 1. Medical Staff Furloughs by State, March 27 to May 22, 2020
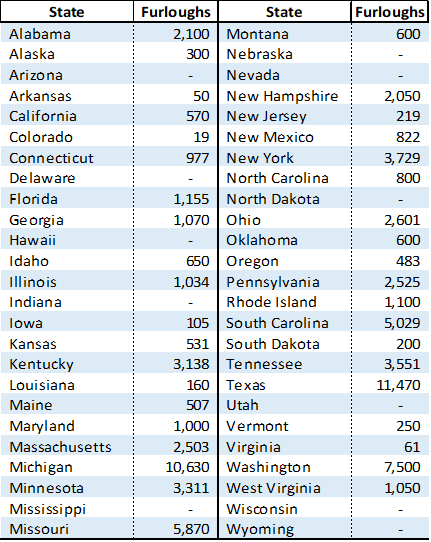
Source: Becker’s Hospital CFO Report, May 22, 2020.
Santa Barbara County has experienced its own high-profile health-sector cutbacks. According to reports in the Santa Barbara News-Press[6] and Noozhawk,[7] the Sansum Clinic, one of Santa Barbara County’s largest health providers, has furloughed 500 non-physician employees, equivalent to 50 percent of its staff. This staff reduction came in response to a 50-percent drop in the volume of patients and in revenues. The clinic deferred surgeries, colonoscopies, and other procedures in response to public directives. Some of the furloughed personnel were being recalled in May as these procedures were starting to be performed.
Approximating the Costs of the Stay-at-Home Orders
In normal times, about 7.5 percent of US gross domestic product (GDP) originates from the health care sector. Table 2 illustrates the composition of this contribution to national output by sub-sector (offices of physicians, hospitals, etc.) for 2018, the most recent year for which data are available. Based on the case-study interviews reported here, we made educated guesses regarding the nation-wide reductions in net income (as opposed to revenues) in each sub-sector. Our logic is that as a rule, net income (covering all costs as well as a reasonable return on investments) needs to approximate the value of services provided to patients. If patients did not receive value of care at least sufficient to pay this level of net income, they would not seek the care. So these net income values are a good measure of the social worth of the care provided. Reduced net income corresponds to a rough dollar measure of losses in patient welfare.
Table 2. Short-term Net Losses of US Health-Care GDP Due to Pandemic Lockdown
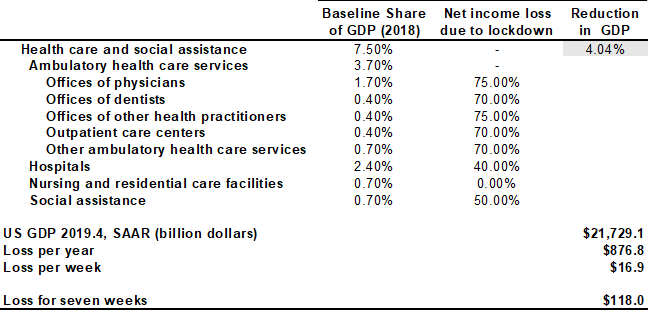
Source: US Bureau of Economic Analysis, 2020, and estimates prepared for this study.
We estimate that lockdown restrictions reduced net income in the health-care sector by more than half. When applied to the share of GDP which the health-care sector represents, losses in net income by subsector leads to estimate of 4.04 percentage points reduced GDP, which applied to 2019 Q4 GDP is equivalent to $876.8 billion per year, which translates to $16.9 billion per week. For the seven weeks that the restrictions on health care were most stringently in place (March 15 to May 2), this amounts to $118.0 billion. We could as a nation pay almost 2 million health-care workers average annual salaries of $60,000 and employ them for an entire year for this amount of money.
Conclusion
We need to learn from this experience and come up with more efficient ways to deal with public-health crises like COVID-19. We may see other crises, either from a resurgence of COVID-19 or some other pandemic. Imposing these kinds of damages on our health-care sector reduces our capacity to deal with health problems in the future. The health-care professionals we interviewed stressed the need for more balanced media coverage of pandemic risks, stockpiling inventories of critical supplies, and achieving greater targeting and flexibility (including use of tele-health) for individual practitioners. These are great places to start.
[1] Santa Barbara County Public Health Department, Status Report
[2] State of California, Santa Barbara County, Statista.com
[3] Culver, Jordan, California is Days away from its projected coronavirus peak. Here’s how the state is prepared to ‘bend the curve.’ USA Today. April 12, 2020
[4] California Department of Public Health. California COVID-19 By The Numbers
[5] Paavoal, Alia, 243 hospitals furloughing workers in response to COVID-19. Becker’s Hospital CFO Report. April 7, 2020
[6] Masuda, Nick, Suffering financially, Sansum Clinic puts 50% of workforce on furlough. Santa Barbara News-Press. March 26, 2020.
[7] Magnoli, Giana, Sansum Clinic Furloughs 500 Employees After Huge Drop in Patient Visits. Noozhawk. March 26, 2020.