September 23 2021
Water Bill Impact Calculator: An improved methodology for evaluating financial impacts of water rate adjustments on customers

For Californians, water is a precious commodity. This is evident in our growing water bills, which were already among the highest in the country. Water rate design in California is highly regulated, not only to ensure equitable cost recovery from ratepayers, but also to keep the rates for reasonable usage as affordable as possible. RDN has developed a new tool to help water agencies across California evaluate the financial impact of proposed water rates on customers. Our Bill Impact Calculator compares each customer’s annual bill under an agency’s current rates to potential rate adjustments. Visualizing this comparison allows agencies to select the rates that minimize impacts across all customers while still securing enough revenue to reliably provide clean water.
Before we discuss our Water Bill Impact Calculator, it is important to understand a little about the water rate design process. Water agencies across California are tasked with designing rate structures that determine each customer’s water bills. Under California law, water rates must be based on the cost the agency incurs to provide service. That cost must be allocated to customers commensurate with their service requirements (Proposition 218). There are several factors that agencies must consider when calculating water rates, such as revenue stability, customer equity, rate affordability, ease of implementation, and conservation incentives. Because these factors may conflict with each other, rates need to strike a balance between multiple considerations. Depending on how the rates are designed, each rate option can have drastically different impacts on customers. Traditionally, the consideration of new rate impacts has included a measure of hypothetical monthly usage levels as shown in Figure 1.
Figure 1. Hypothetical Customer Bill Impact, Single Family Residential Customers on 5/8-inch Meter
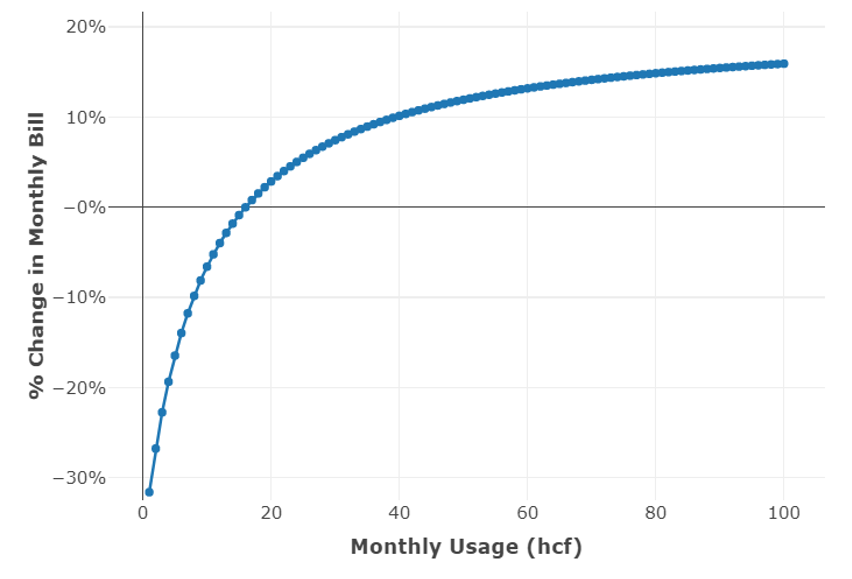
Note: This report analyzes the actual billing records of 1,000 Single Family Residential (SFR) customers with 5/8” meters. Customer class and meter size held constant for ease of comparison.
Hypothetical evaluations of customer bill impacts can be misleading. For example, Figure 1 shows usage up to 100 hcf resulting in a bill increase of about 16 percent. If a utility wants to keep all customer impacts below 10 percent, then this set of rates fails to achieve that goal; however, this hypothetical customer analysis does not account for the typical usage of most of the utility’s customers. In a sample utility of 1,000 customers drawn from actual utility usage records, about 80 percent of customers use less than 20 hcf of water each month, meaning only a handful of large users will have bill impacts greater than 5 percent. Additionally, most of the sample is clustered around 10 hcf of water use per month, meaning that most customers will actually see a decrease in their bills.
RDN has designed a Water Bill Impact Calculator that, rather than evaluating hypothetical customer bills at different usage levels, can evaluate the impact of potential rate changes to each individual customer based on their historical usage. By evaluating bill impacts at the customer-level, RDN can overcome the limitations of the industry-standard approach to this analysis. To demonstrate the improved accuracy of this approach, Figure 2 below compares the bill impacts of a potential rate adjustment, using the industry-standard hypothetical customer approach vs. RDN’s individual customer-level analysis.
Figure 2. Hypothetical Bill Impact Curve vs. RDN Customer Level Analysis
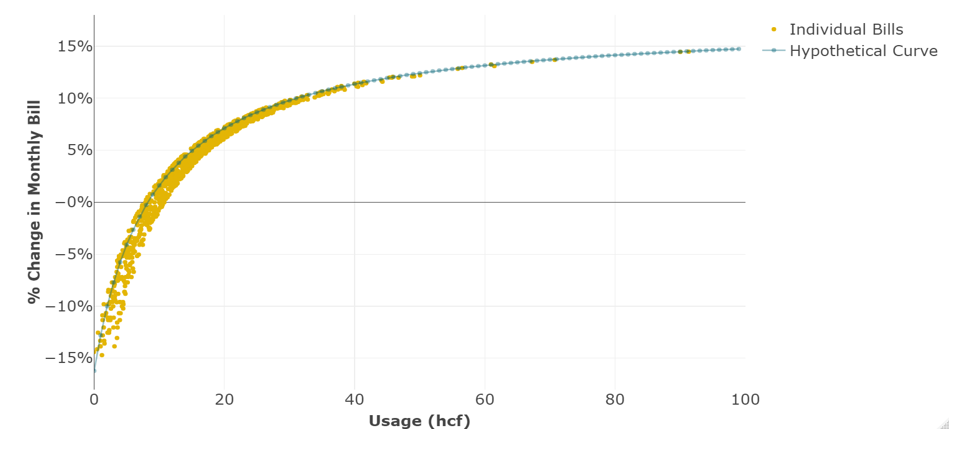
As you can see, using the distribution of customers’ actual historic usage will results in a more accurate assessment of the revenue impacts for the utility as compared to the hypothetical analysis. The following section describes how RDN uses this Water Bill Impact Calculator to recommend water rate structures that minimize the financial impact of rate adjustments while still collecting sufficient revenue to provide reliable, safe service.
Individual Customer Level Bill Impact Analysis
This section demonstrates RDN’s Water Bill Impact Calculator by comparing the impacts of two proposed rate structures on the same group of customers. In our example, the utility determines that the revenue requirement from rates for the coming year is $681,000, an increase of 5 percent from the current revenue requirement. The current rate structure recovers 67 percent of revenues from variable charges and 33% from fixed charges. For this example, let’s consider two other rate structures. Rate Option 1 recovers revenue with a 75:25 percent split between variable and fixed charge revenue, respectively. In contrast, Rate Option 2 recovers revenue using a 25:75 percent split between variable and fixed charges. Both rate structures would generate the same revenue, $681,000, but in drastically different ways. Table 1 displays the current and proposed rate structures for a 5/8” meter, which is typical for most single-family residences.
Table 1. Current and Proposed Rates to Recover Target Revenue ($681,000)
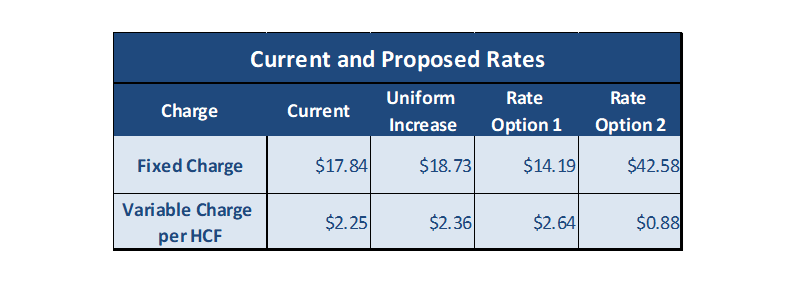
Figure 3 below displays each customer’s change in monthly bills under the three scenarios designed to meet the new revenue requirements: uniform escalation of current rates, Rate Option, 1 and Rate Option 2. Each point on the chart represents a unique customer. A negative percentage indicates that the customer’s bill will decrease under the new rates while any impact greater than zero indicates a bill increase.
The first scenario we will examine uses the existing rate structure but escalates the current rates by five percent to meet the increase in required revenue, displayed in gold in Figure 3. Here, customers’ bills will uniformly increase by five percent. This horizontal line represents the lowest possible aggregate impact on customers’ bills because it does not change the structure of the actual rates. We can consider this a “baseline” for evaluating the impact of alternative rate structures, as we will do with Rate Options 1 and 2.
Figure 3. Bill Impacts under three Rate Options
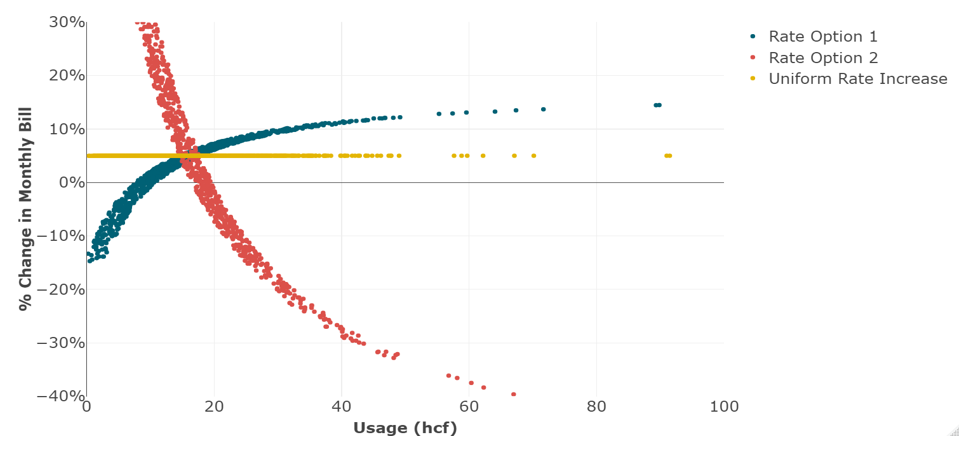
Under Rate Option 1, displayed in blue, customers who use about 10 hcf or less will see reductions in their bills while customers who use more than 10 hcf will see an increase, thus providing a price signal to conserve and protecting smaller users against rate increases. However, because so much weight is put on the variable portion of the rates, a decline in customer usage (due to drought restrictions or conservation efforts, for example) could cause a revenue shortfall. In summary, Rate Option 1 will increase affordability for small users and promote conservation, but also decrease revenue stability.
The red points display the same customer’s bill impacts under Rate Option 2. Under these new rates, customers that use 10 hcf or less will have significantly higher bills when compared to Rate Option 1. This is because the proportion of the bill that is fixed is much higher than under the current rate structure (increasing from 33 percent of the total bill to 75 percent). Therefore, customers’ total water bill would actually decrease starting around 18 hcf. For the water agency, Rate Option 2 provides more revenue stability, which is important for providing reliable service to customers. On the other hand, by emphasizing the fixed portion of the rates, Rate Option 2 fails to provide the incentive for conserving water that we have in Rate Option 1.
Conclusion
Designing water rates requires balancing several important criteria. Each agency is responsible for prioritizing these criteria based on the unique needs of their system and their customers. When priorities change, agencies will ask economic and financial experts to design and evaluate different rate structures. This can include changing the balance of fixed vs. variable rates, changing the number of variable rate tiers, or implementing different rates for different types of customers, such as commercial vs. residential. Not only does changing the rate structure have financial implications for how the agency will recover needed revenue, it can also significantly change an individual customer’s water bill.
We believe that it is imperative for water agencies to accurately assess how changes to water rates will impact their customers. RDN uses our Water Bill Impact Calculator to evaluate how different rate structures will impact customers based on their actual historical usage. This provides a far more accurate analysis of customer bill impacts than the hypothetical customer analysis typically seen in the rate-consulting industry. We hope that this tool will equip water agencies throughout California to better assess how changes to water rates will impact customer bills and therefore better serve our communities.
Robert D. Niehaus, Inc. (RDN) is an economic consulting firm based in Santa Barbara, CA specializing in regional and resource economic analysis for public and private agencies and utilities. To learn more about RDN and our services, please visit our website or contact us.
To speak with an RDN representative about this release, please contact Andrew Clark, Marketing Manager, at Andrew@rdniehaus.com or 805-962-0611.